Lava Turned into Squares on the Map
Atlas #12 · Reading the island
Updated 24 October 2026: Added archived engine views of the Lava Tip and Hundred Arches, with their source versions.
In this post
Near Dhundsar on Atlas's island, an orange band of lava broke into little squares on the map. Bright channels crossed the field in sharp turns and diagonal staircases.
Dhundsar means “mist lake” in the Atlas naming record. A map should help someone standing on the Lava Tip read the paths of hot rock. Here its own pattern competed with the landscape: small, hard blocks, with a diagonal staircase where the colour changed.
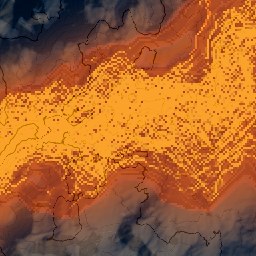
The published map around
Dhundsar, at
4 metres per pixel. This is the original tile, not an enlarged or retouched
crop. It was baked on 2026-10-23, terrain 3c3cabea5aae5256, map style
ca2a21437f94598a. The squares are especially clear through the middle of
the orange band.
Why the Lava Map Shows Squares#
Imagine copying a large drawing from a small sheet of coloured squares. For every dot on the drawing, you ask only the nearest square what colour it is. Until you cross into another square, the answer stays exactly the same. At the boundary it changes all at once.
That is what the lava reader did. It stored its measurements on an 8-metre grid, while this map drew a pixel every 4 metres. Each nearest-cell answer could therefore occupy two map pixels along each side.
The correction being tested asks the surrounding squares and blends their answers according to distance. Move a little, and the colour can change a little. It does not need an imaginary boundary where the whole answer switches.
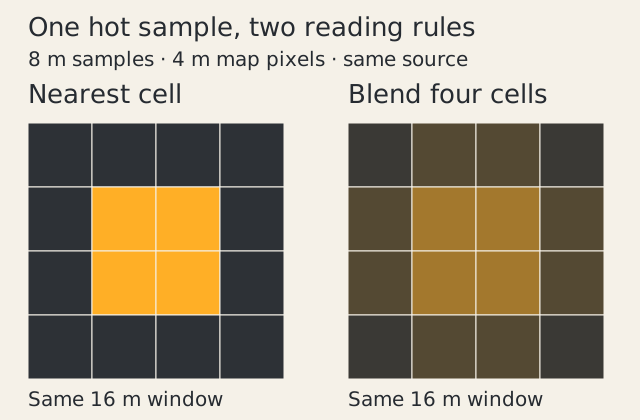
A small explanatory model, not a game screenshot: the source samples stay fixed while the reading rule changes. The before/after game maps need their own matched render and review, shown below.
Orange Lava Bands Revealed the Grid#
The paper map of the same tile does not draw the active lava in orange. Its relief and contours still show through, but the bright block pattern is much less conspicuous.
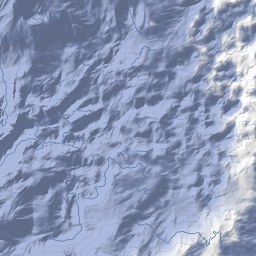
The same published tile and terrain, with the official paper styling. This is a comparison of styles, not the corrected after shot.
That narrowed the investigation to the lava colour channels. It did not prove the terrain was faultless. It did show why blurring the whole map would be a poor first move: it would soften the ridges and contours as well as the offending colour.
Reading a Lava Landscape on the Map#
The ontology separates a volcanic biome from the volcanic land beneath it. A lava field can include channels carrying concentrated flows and lava fans where those flows spread. These are useful distinctions for a map: a narrow channel should remain readable beside a broad sheet of lava.
Other entries describe ash plains, basalt columns and columnar basalt faces. The volcanic stone is a material; its shape is a different question. A lava tube is an enclosed passage, so a surface stripe alone cannot establish that one lies below it. These links define the landscape vocabulary; the matched images below remain the evidence for this particular crop.
At the Lava Tip cliff, the catalogue also connects the landscape to volcanic coasts and lava entering the sea. A readable map should help a traveller distinguish landforms at each scale. Smoothing a colour boundary is only one part of that work.
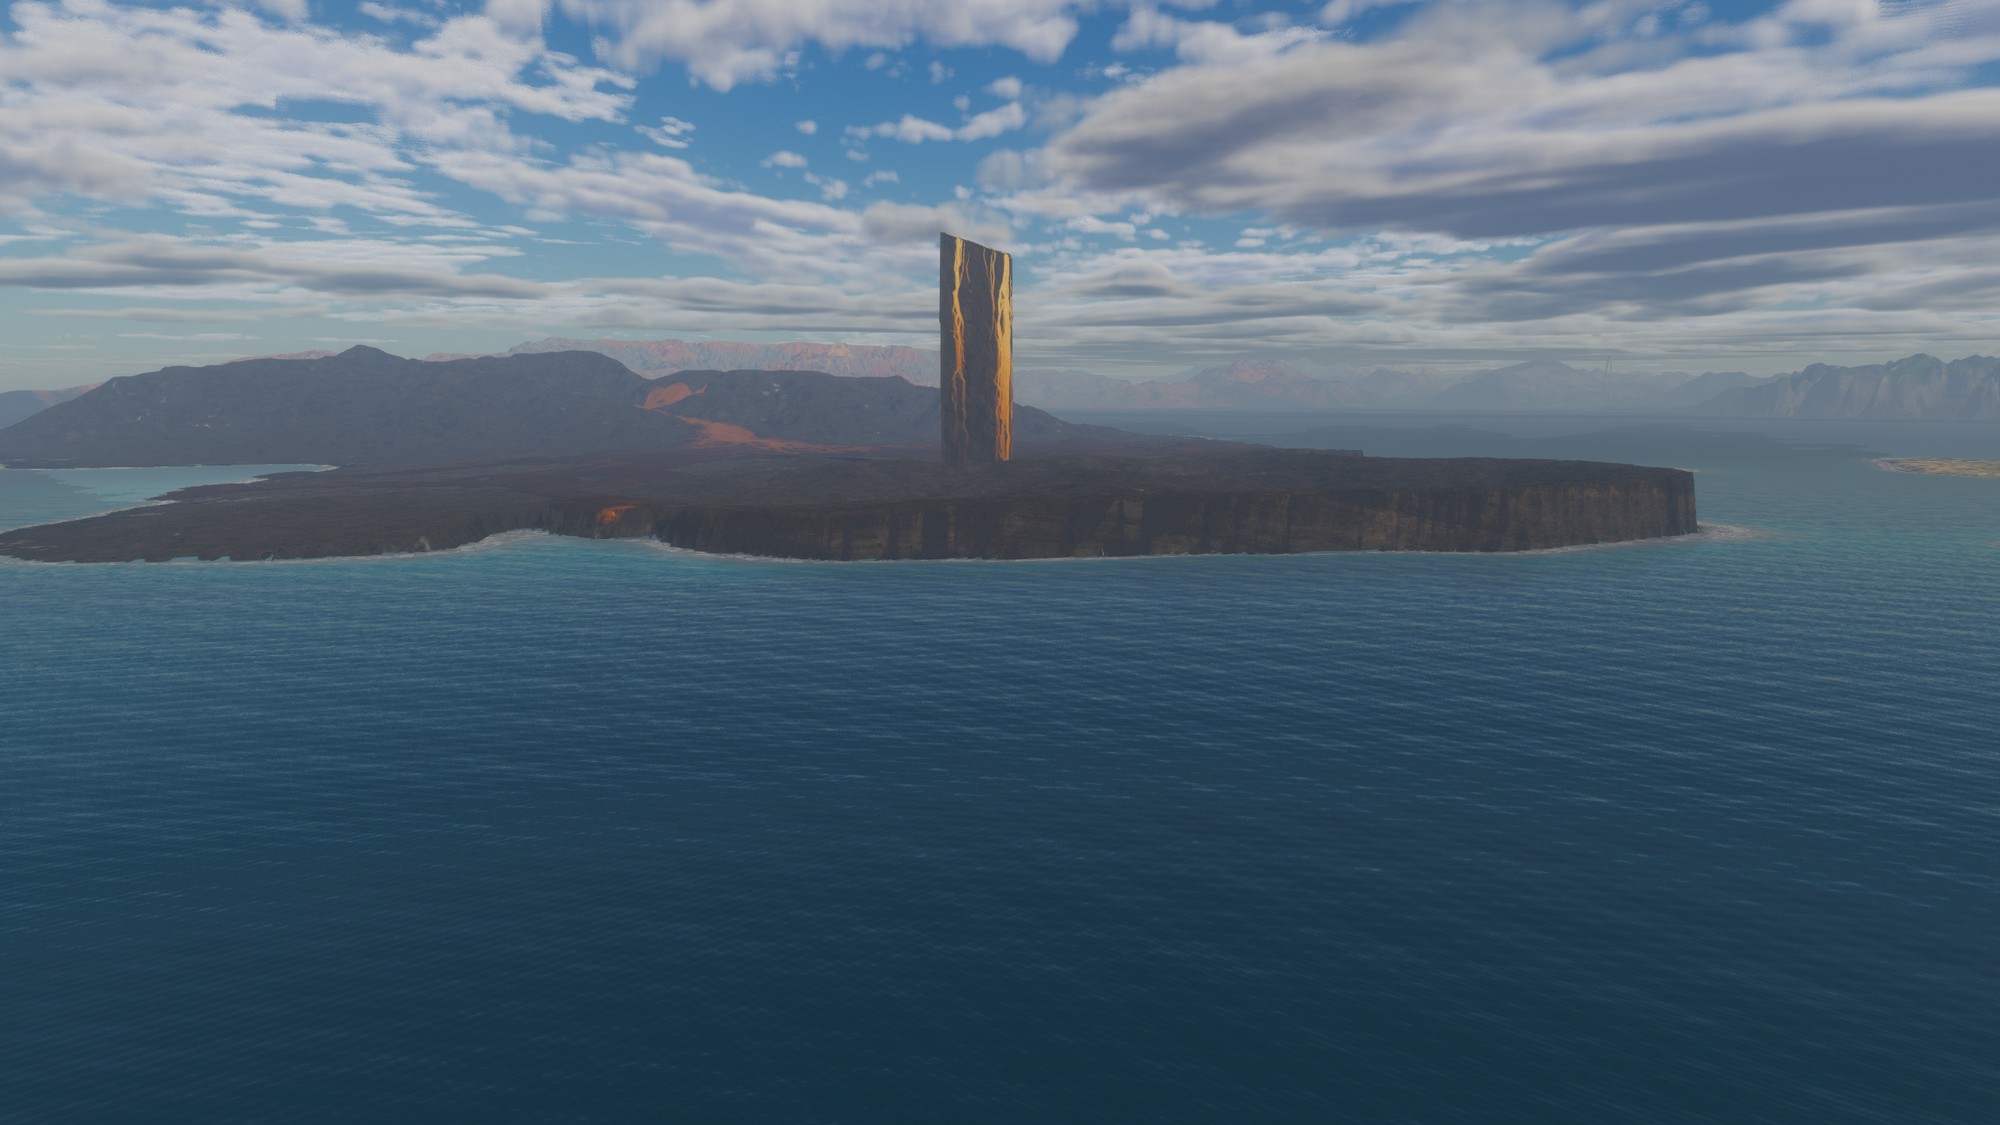
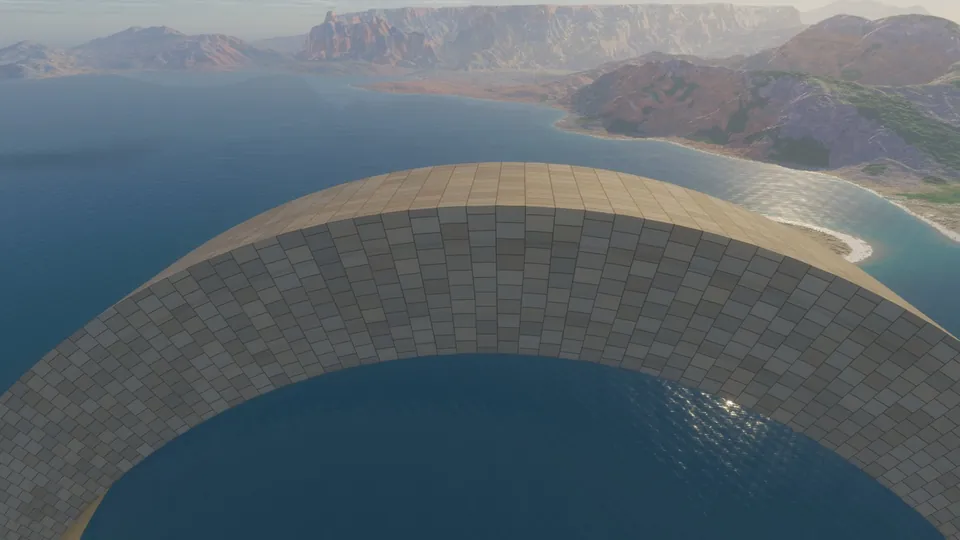
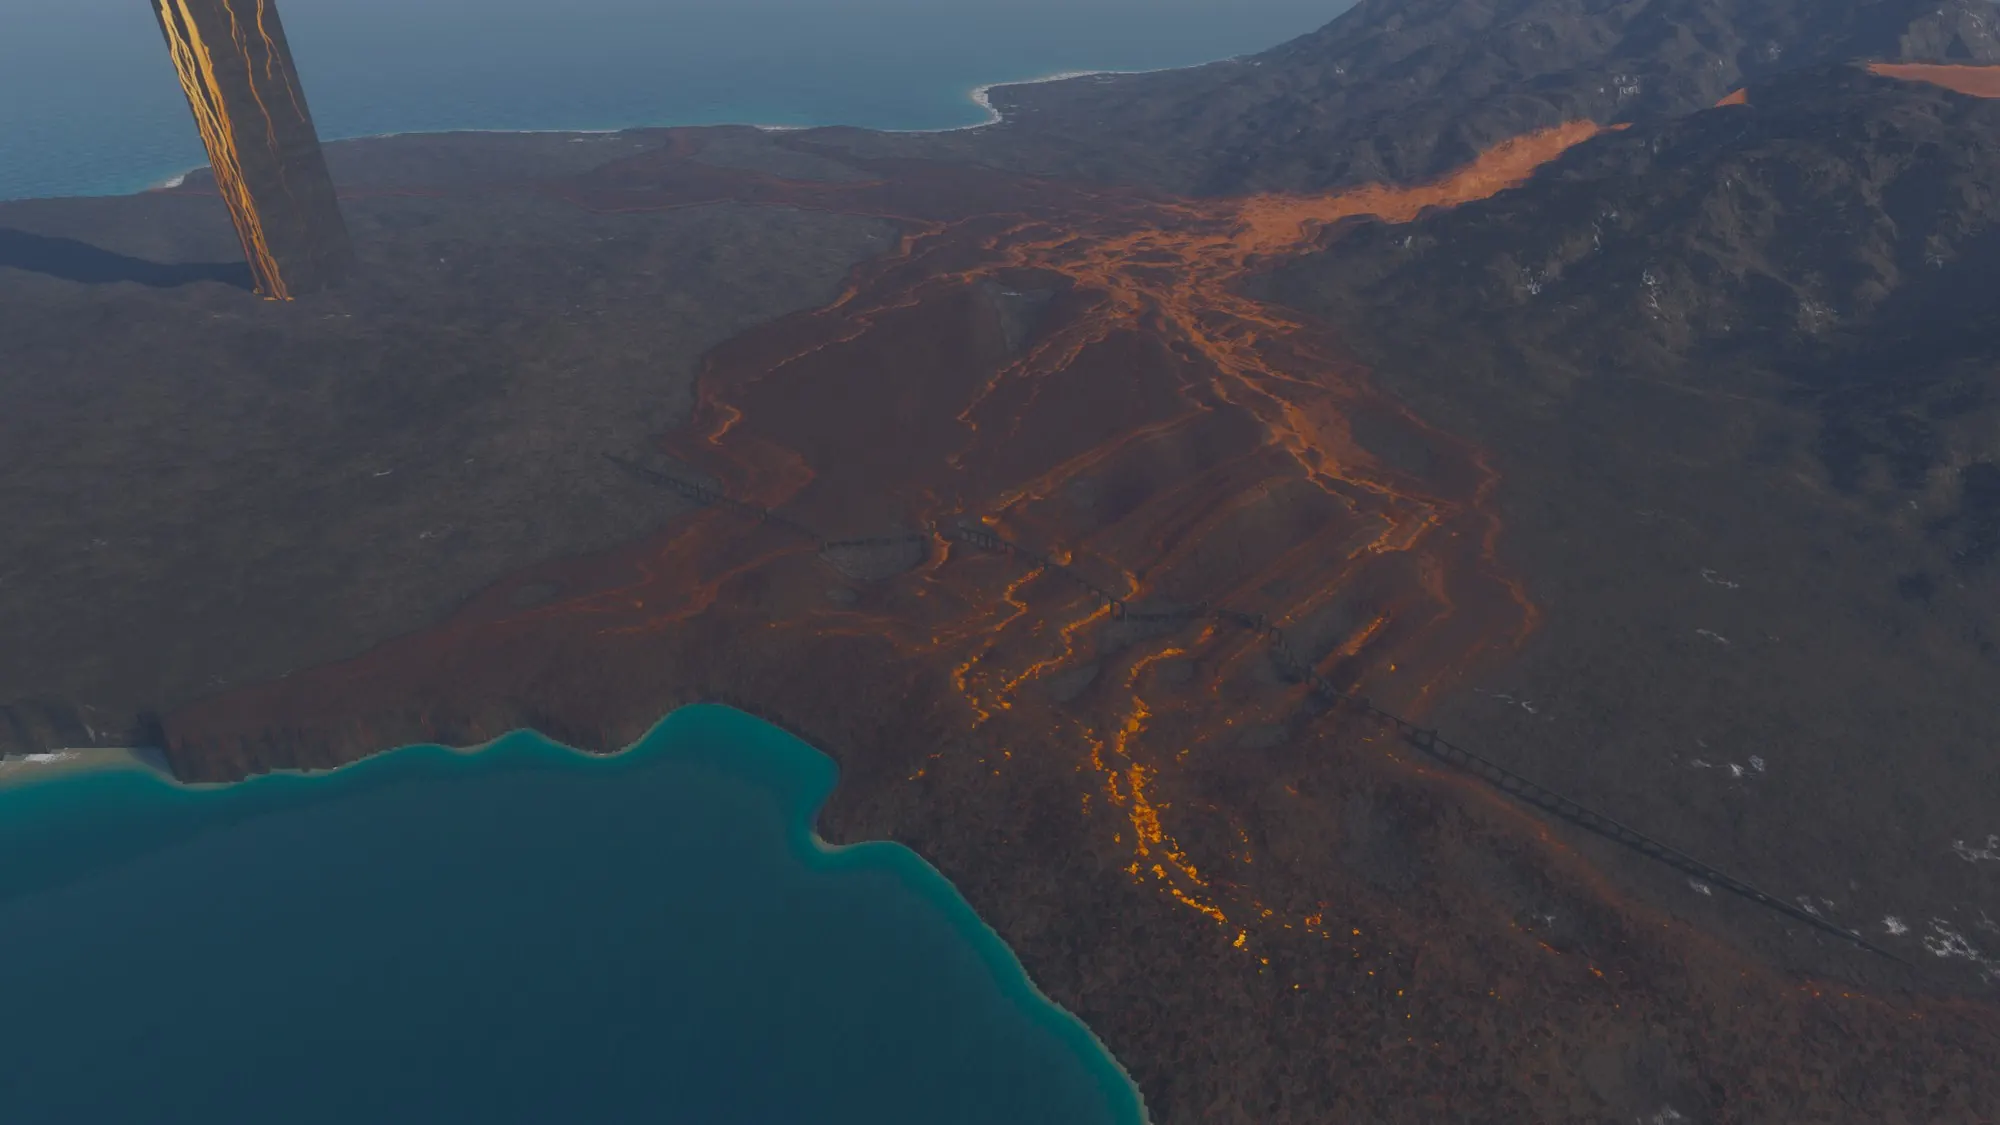
The Lava Tip and Black Shard, rendered in the Atlas engine on 17 October 2026 at commit c65fcf7. Render record, version 2. This archived view shows the landscape; the map comparison below has its own source version.
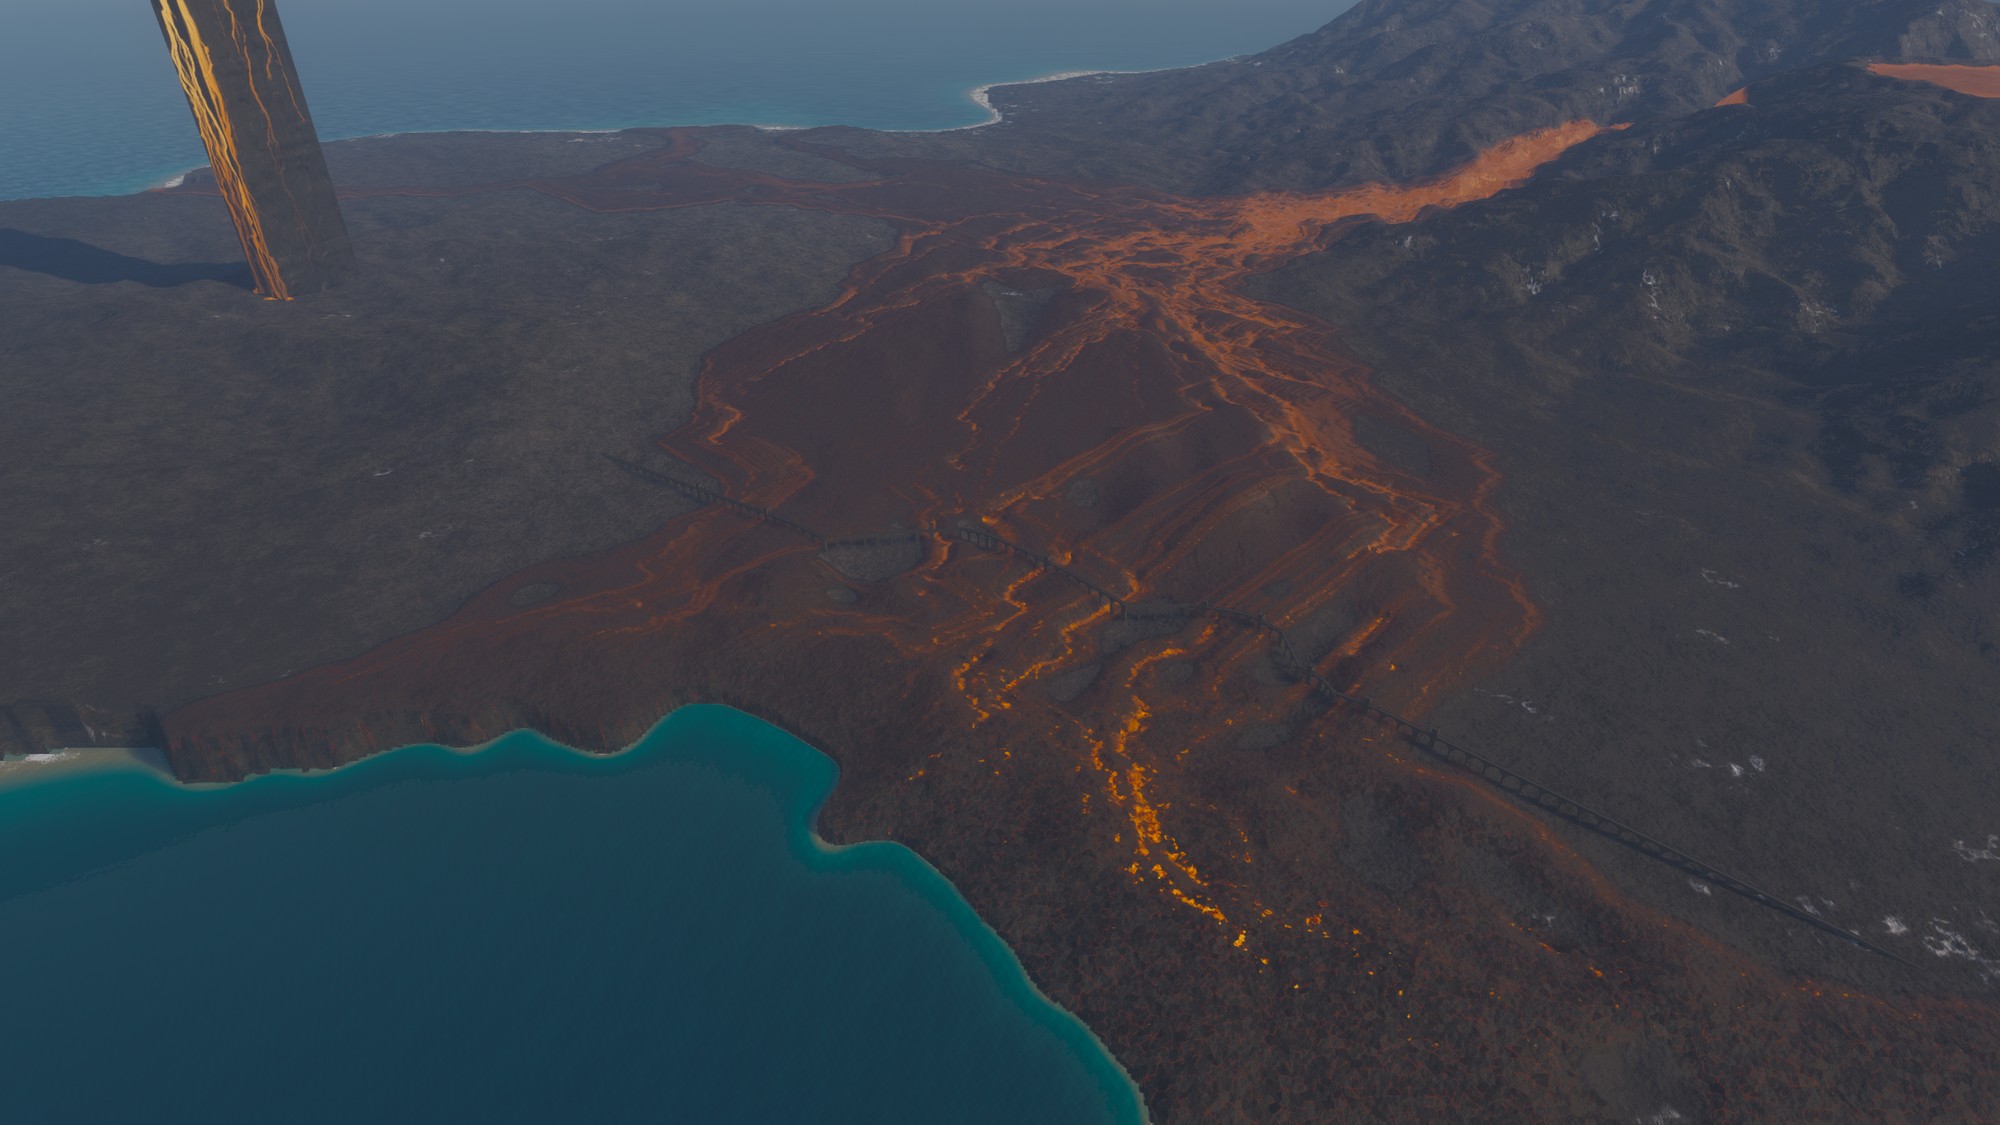
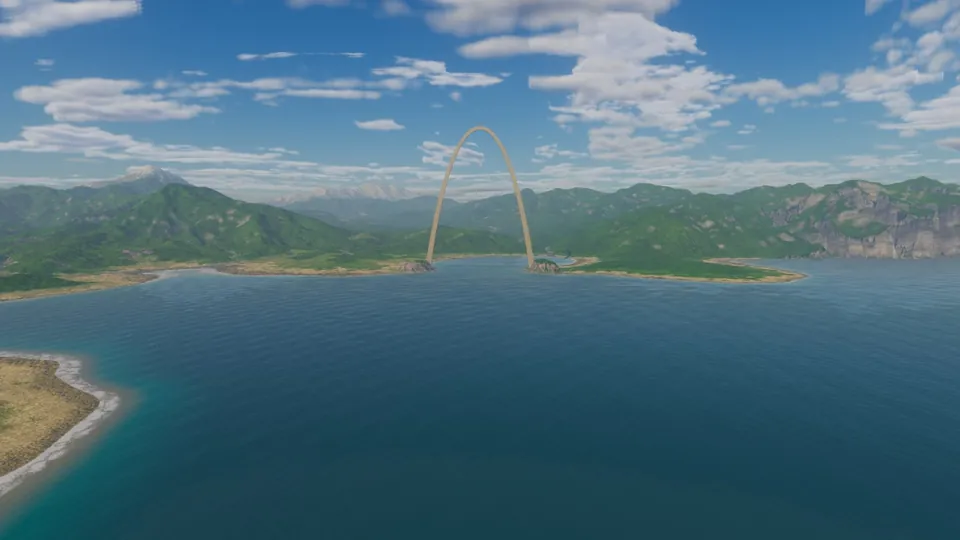
The Hundred Arches among the lava flows, rendered on 17 October 2026 at commit c65fcf7; this is also the header image. Render record, version 1. An engine rendering, not an after shot of the map-sampling candidate.
How the Map Samples Lava Between Grid Points#
The lava field keeps cell-centred measurements: the share covered by a flow, its age, molten and open melt, and the glow around it. The existing footprint reader rounds the requested position to a cell centre. For a small footprint it returns that nearest cell's values.
A release regression makes the discontinuity explicit. On a synthetic boundary, moving the query by just 2 millimetres changes a coverage channel from 0 to 1. The lava field has not changed; the query has crossed the reader's rounding boundary.
The candidate changes the map reader. It interpolates between the four surrounding cell-centred footprint summaries. If the horizontal fraction is x and the vertical fraction is y, their weights are (1−x)(1−y), x(1−y), (1−x)y and xy.
There are two details to keep honest. Flow age is an average over the lava that actually covers the ground, so empty ground must not make fresh lava look old. And the coarse summaries deliberately retain the strongest molten channel, so a narrow hot stream still has a chance to show when the map is far away. The tests check those properties alongside continuity, constant fields and the empty area outside the simulated field.
The fine contours already used height and slope to measure their distance from each pixel. That part of the map was looking between its samples. The lava colour still asked for the nearest square.
Smoother Maps Still Distort Narrow Lava Channels#
These pairs use the current source, the same world position, the same palette and the same map settings. The left image uses the original reader; the right uses the interpolation candidate. They are newly rendered pairs, not a comparison between the older published tile and new terrain.
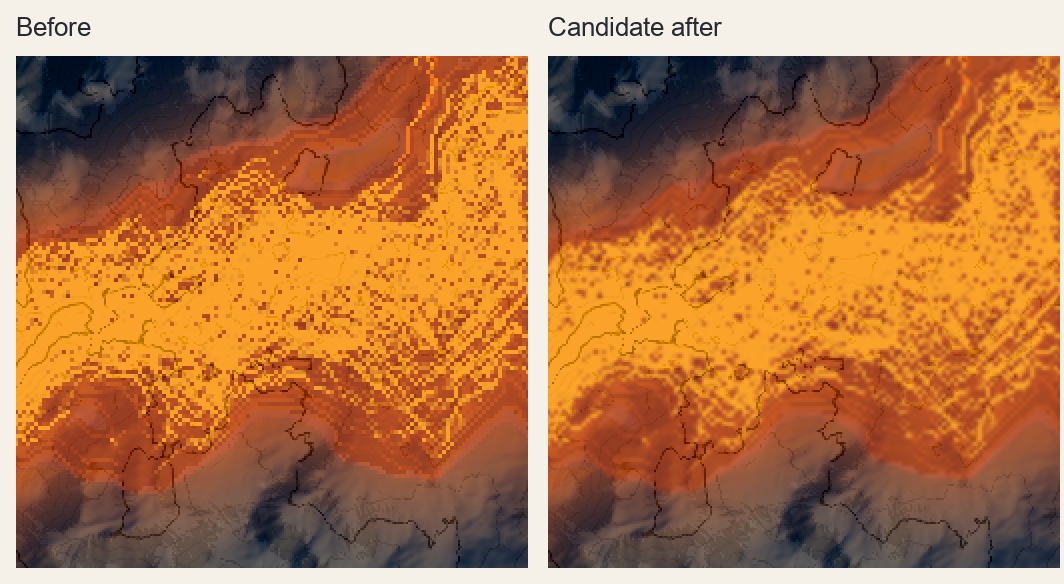
4 metres per pixel. Before on the left, candidate after on the right. Each original map is enlarged by nearest-pixel duplication for inspection; no sharpening, colour changes or smoothing have been applied to the pictures. Look at the square dark marks in the bright central field.
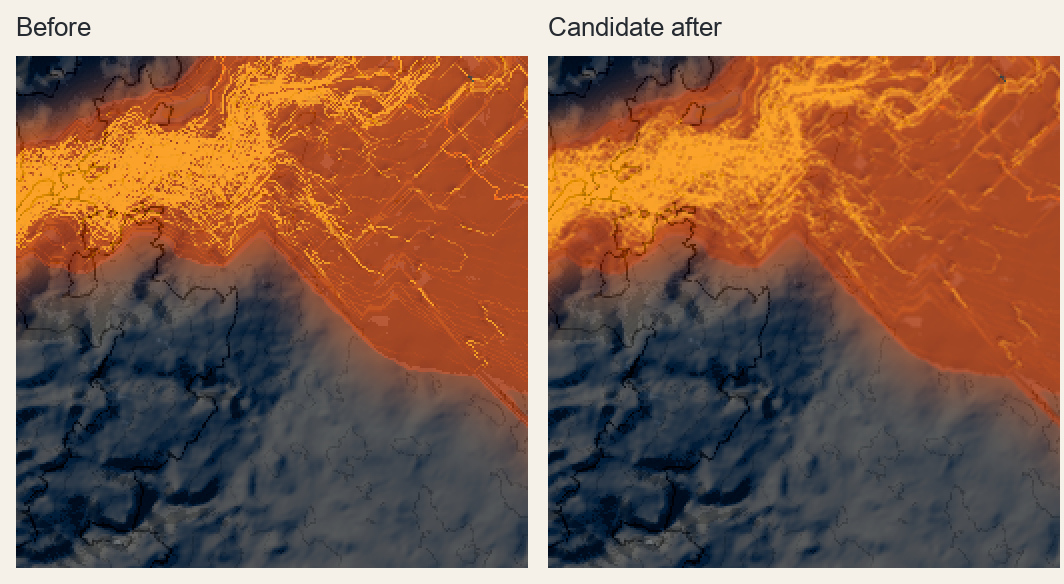
8 metres per pixel. The broad hot area reads more continuously on the right, but the diagonal, near-parallel line system remains. Some thin branches become less distinct. That is a cost, not evidence that every channel survived.
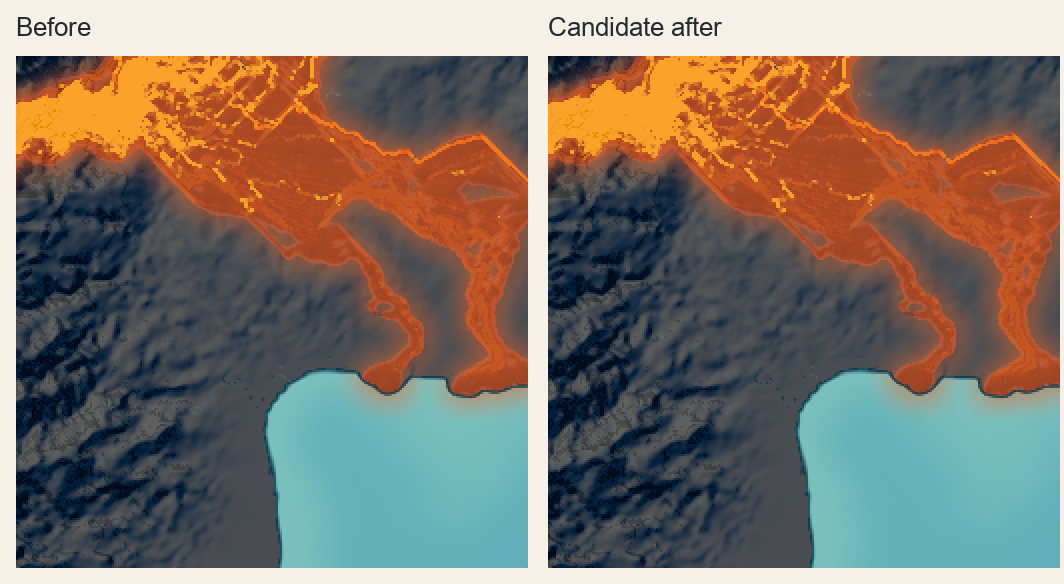
16 metres per pixel. The two outputs are byte-identical. Large bright blocks and angular channels remain; this candidate does not improve them.
A fresh reviewer saw all the views under shuffled labels, without knowing which treatment was newer. The reviewer preferred the candidate at the finer scales with moderate confidence, but rejected both as free of major artifacts. In particular, the regular channel-like lattice was still a major fault. Softening it had not corrected its geometry.
The comparison also checked what had stayed fixed. Exported terrain heights and map classes were bit-identical for every pair. The change is in how the map reads its lava display channels; it does not demonstrate a correction to the simulated terrain. Nor does it prove whether the remaining regular lines originate in the flow model, its stored summaries or another reading rule. That cause still needs to be separated from this proven rounding bug.
Which Maps Have Changed#
The original reader fails the continuity regression. The local candidate passes the continuity, constant-field, exterior, age and narrow-hot-channel controls, along with strict release checks. It has not been accepted or published as the finished visual correction.
The hot field still crosses the map in squares and sharp turns. When does a branch on the map belong to the island, and when does it belong to the grid?